I came across JMeter a while back but never got a chance to try it out. From the JMeter website:
Apache JMeter is a 100% pure Java desktop application designed to load test functional behavior and measure performance. It was originally designed for testing Web Applications but has since expanded to other test functions.
This weekend I was able to test load on my 256 slice which this blog is running on. Here’s what I did:
- Download the binary
You can get the binary here. - Unzip the tarball/zip file
I extracted it file to/Users/theo/tools/jakarta-jmeter-2.3.1 - Start up JMeter
Go to thebindirectory. Runjmeter.sh(jmeter.batif using Windows) from the command line. - Create a Test Plan
Just give a name and any description you want for your test plan.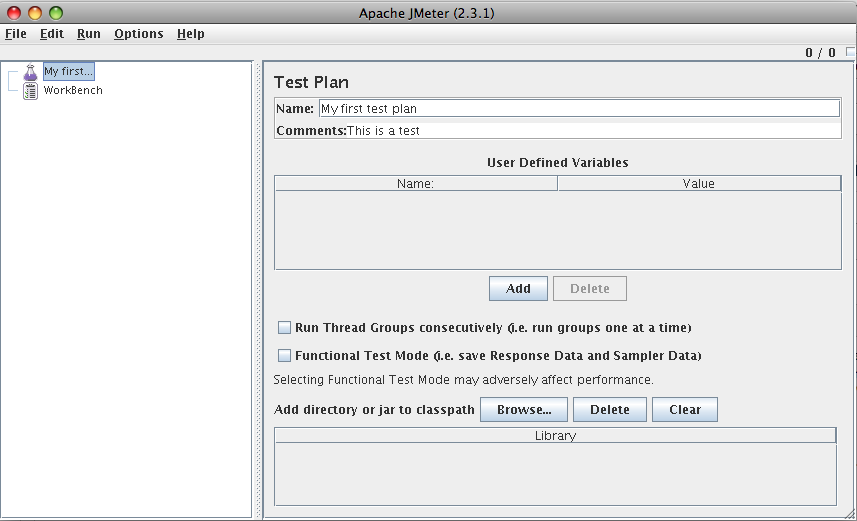
- Create a Thread Group
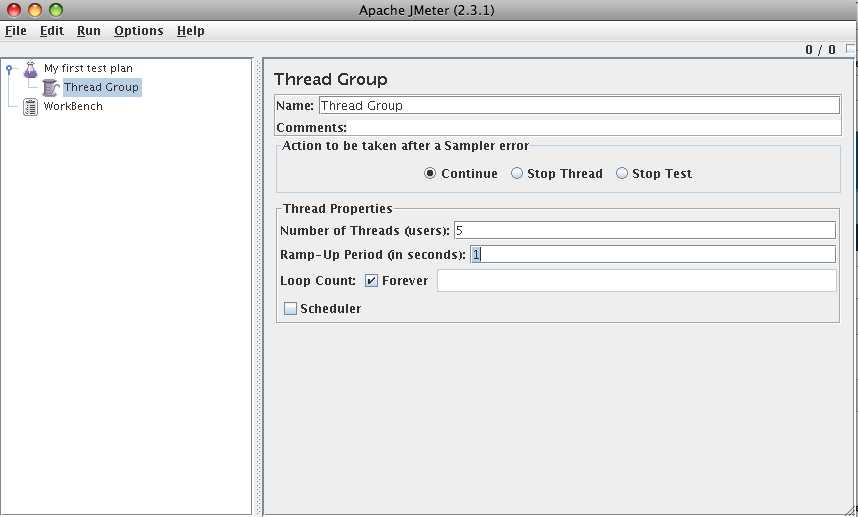
A thread group allows you to specify the amount of load you want to simulate. Select your test plan from the left Tree view, right-click, and select Add -> Thread Group.Configurable fields include:
- Number of threads – the number of connections or users you want to simulate
- Ramp up period – the amount of time in seconds to take to reach the number of threads specified. If you choose 0, all of the threads will be created at the start of the test.
- Loop count – you can specify to loop indefinitely or provide a number of times to run through the test.
- Add a Sampler
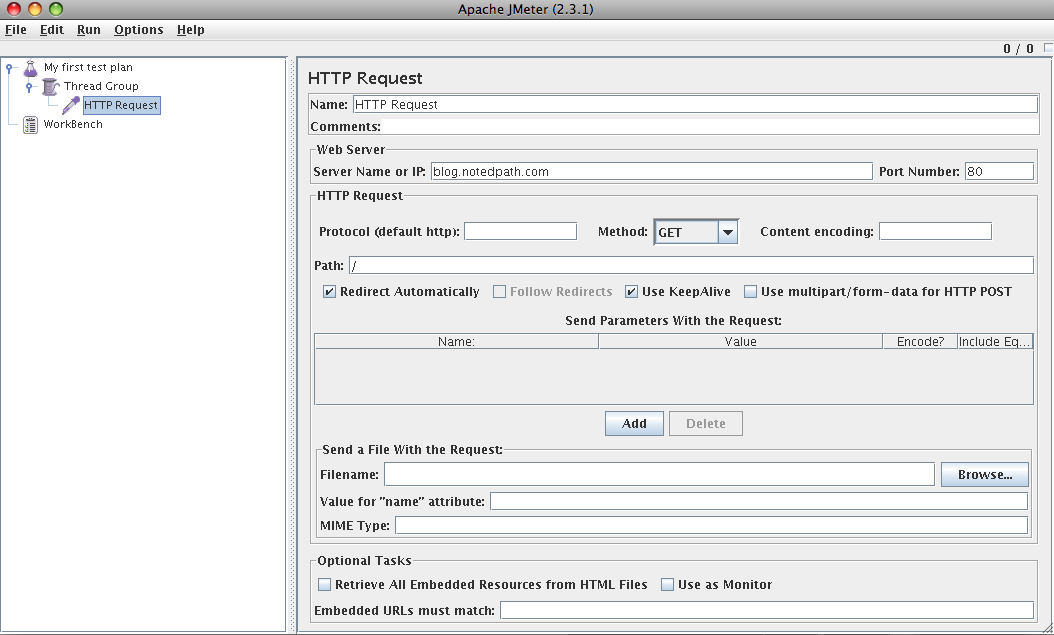
A sampler is a type of request you want to make. In this example, I used an HTTP request to test load to a web server. It’s good to note JMeter supports multiple types of samplers including web services, JMS, and JDBC. Add a sampler by selecting the Thread Group you just created, right-click, select Add -> Sampler -> HTTP Request.Configurable properties include:
- Server Name – what the ip or url is to the server the request it to
- Port – the port the server is listening to
- Protocol – the protocol (http, https, etc)
- Method – HTTP method (POST,GET, PUT, DELETE, etc)
- Path – the URL path to request
- Add a Listener
A listener allows you to collect data points and display them in some fashion like a graph or a table. I used the Graph Results listener by selecting the Thread Group, right-click, select Add -> Listener -> Graph Results. - Run the test!
Now we are ready to run the test. From the file menu bar, select Run ->Start. You will be prompted to save your test plan. You can save it or just hit “No”. You should see data points begin to be plotted on the Graph Result or whatever listener you selected.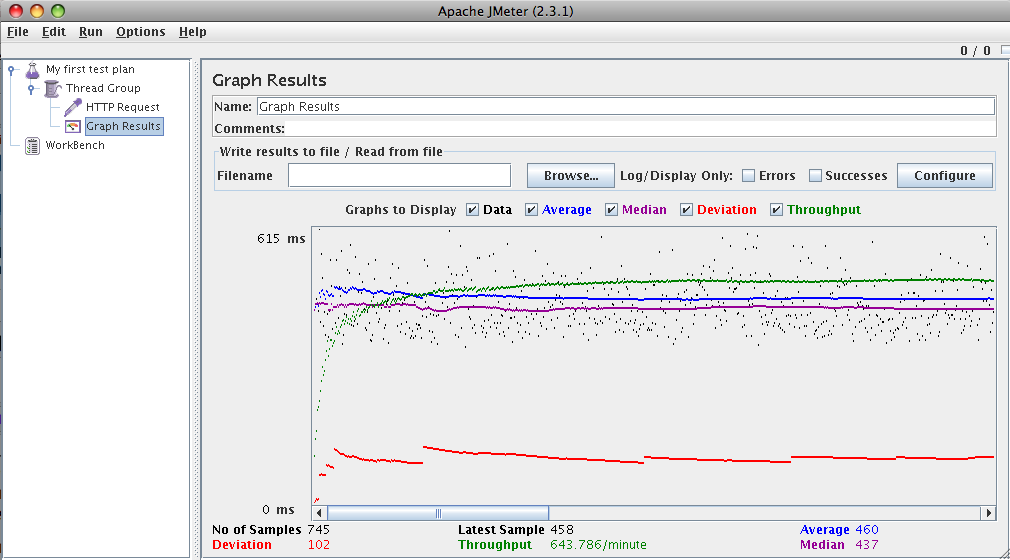
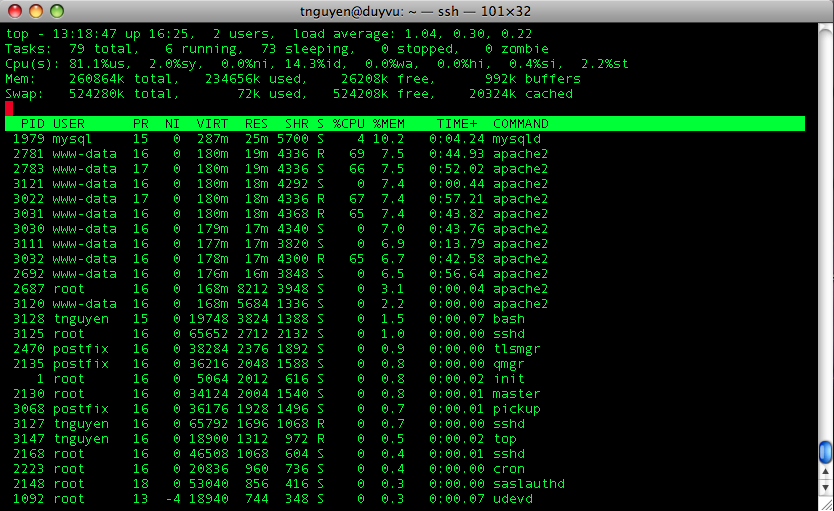
I monitored the usage from my slice as well and this is what top showed me:You can see the 5 threads we specified in the Thread Group taking up 5 apache processes.
- Interpret the results
Tests are worthless without interpreting the results. So, what the heck does this graph tell me? Pretty good documentation can be found here. Basically, given the load scenario we have setup, my slice can handle ~643 requests/minute or ~11 requests/second. I am not sure what kind of numbers I should be getting but these seem pretty good to me. One last thing to note is that JMeter is not a web browser so these metrics don’t include rendering time or execution of any JavaScript.
Overall, JMeter seems to be a great open source tool to test different kinds of load on servers. I look forward to trying it out at work. One last thing I came across is JMeter integration with your Ant build process. Check that out here. I would like to hear about other people’s experiences with JMeter, too.
Hi
Yes, JMeter is great tool with lots of features.
You might want to get more realistic numbers by clicking of “Retrieve all embedded…” on the HTTP sampler. Otherwise your are just downloading the HTML text file you have requested on the HTTP sampler.
brgds Jesper Kiaer
http://www.jezzper.com
Hi
Jmeter is a great tool with lots of features, I used it for my web app test with login and other scenarios which gave xml response.
Jmeter is awesome tool
JMeter is good for performance testing, but it has one big disadvantage: very simple out-of-box reporting tools.
I know at least two solution of how to go over this:
– use google-code-jmeter-plugins;
– use Jmeter plugin for cloud testing service.
This is perfect process explanation. thank you so much for sharing. Graphical and Report view analysis in Jmeter
Hi
This post is very useful for me,can you post some drawbacks of jmeter
Thank you